
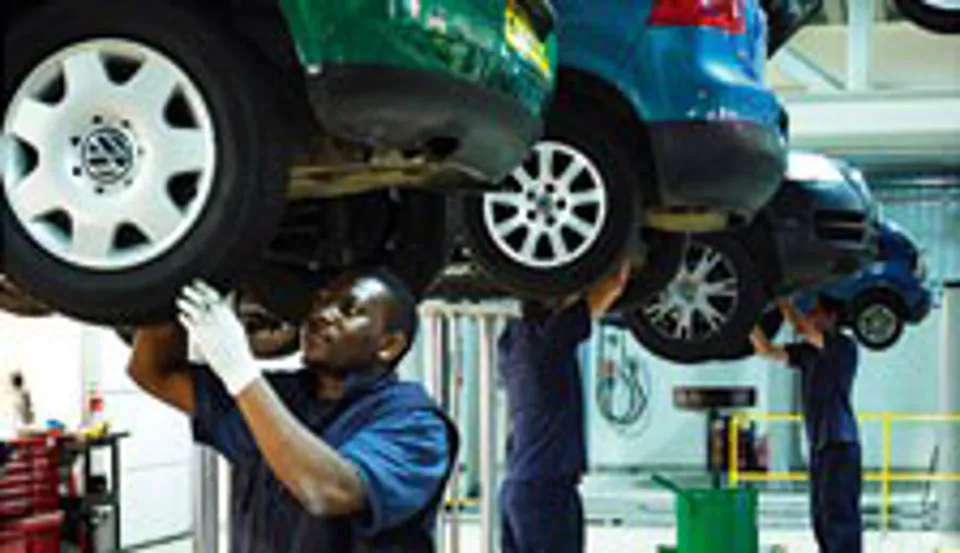
The combined average independent and franchised dealer labour rate has increased by 3% to £83 per hour, according to Warranty Direct’s annual Labour Rates Survey.
The combined average increased from £80.44 in 2011 and has increased by over 10% in the last two years.
Despite the results from the survey, many dealers are offering service plans to compete against independents and offer fixed monthly payments to avoid worry about unexpected bills and labour rates.
The data is based on 50,000 live policies from Warranty Direct and the study of 4,250 workshops.
Independent garages actually saw labour rates rise the most from £60.68 to £64.58 – a 6.44% rise.
Franchised dealer labour rates saw a slight increase, standing at an average of £95.94, meaning the gap between independent businesses and main dealers has narrowed further, the latter now charging 48.6% more on average than independents (down from 57% in 2011).
Surrey is the most expensive county to get cars fixed; an hour of a mechanic’s time costs £98.27 on average. Vehicle owners in Powys, Wales, are charged the least, with the average of £58.46.
Cornwall and County Durham saw some of the biggest price hikes, rates were up by 12.96% and 11.97% respectively. In contrast, drivers in East Yorkshire and Pembrokeshire are benefitting from drops in labour charges of 14.68% and 14.36% respectively.
Duncan McClure Fisher of Warranty Direct believes "there is also some evidence fixed price service deals are being funded by excessive rates for unexpected repairs".
Top 10 most expensive regions for franchised garage labour rates
(Franchised workshops only)
County Average (£) Maximum (£)
Middlesex 117.97 192.00
Manchester 112.19 147.60
London 108.81 198.74
Surrey 107.85 168.00
Berkshire 106.57 164.94
South Glamorgan 106.41 138.00
Essex 106.01 172.80
Hertfordshire 105.71 201.60
Monmouthshire 105.12 144.00
Warwickshire 100.53 142.80
Top 10 least expensive regions for franchised garage labour rates
(Franchised workshops only)
County Average (£) Maximum (£)
West Lothian 59.30 72.00
Invernesshire 69.03 75.00
Anglesey 69.82 78.00
Flintshire 70.77 90.00
Dumfriesshire 72.05 103.68
Mid Glamorgan 72.39 118.20
Northumberland 72.42 118.80
Renfrewshire 73.14 129.60
Inverness-shire 75.56 99.60
County Antrim 78.11 138.00
Top 10 most expensive regions for garage labour rates
(Franchised and non franchised combined)
Region Average cost for an hour’s labour (£) Percentage difference to 2011
Surrey 98.27 6.76
Middlesex 97.19 -1.02
Hertfordshire 94.43 -2.71
Berkshire 93.27 -0.11
London 90.09 -0.72
Essex 89.34 1.53
Wiltshire 88.55 11.36
Cheshire 88.30 6.95
South Glamorgan 87.99 N/A
Top 10 least expensive regions for garage labour rates
(Franchised and non franchised combined)
Region Average cost for an hour’s labour (£) Percentage difference to 2011
Powys 58.46 N/A
Roxburghshire 60.70 N/A
County Down 60.80 N/A
Dunbartonshire 61.20 N/A
West Lothian 61.70 3.39
Ceredigion 61.99 N/A
Invernesshire 62.12 -8.99
Banffshire 62.30 N/A
Mid Glamorgan 64.79 N/A
Renfrewshire 65.09 5.92
Buckinghamshire 86.85 -3.42


Login to comment
Comments
No comments have been made yet.