

It is an enduring belief throughout the used car industry that used residuals rise sharply into January, as showroom footfall increases and retail sales pick up after what is typically an annual low in December.
However, extensive analysis carried out by CAP shows that although this does happen, trade values do not increase as much as commonly believed. Table 1 below, shows the average (mean) percentage movements in January editions of Black Book over the past six years.
After disregarding 2008 and 2009, which most would agree were both exceptional years, values rise by an average 0.44% at 3 years 60,000 miles, and by 0.49% at 1 year 20,000 miles, or by £35 and £70 respectively (based on typical values for those ages & mileages).
CAP Black Book - Average January % Movements
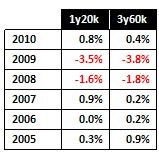
As can be seen from the above table, January 2010 was no exception to this trend, although the size of value increase at 1y/20k is slightly higher, no doubt assisted by reduced levels of late-plate stock caused by the reduction in short-cycle business written by manufacturers in 2009.
Anecdotal research collected by CAP throughout January confirms that the weather has had a sizeable impact on trading.
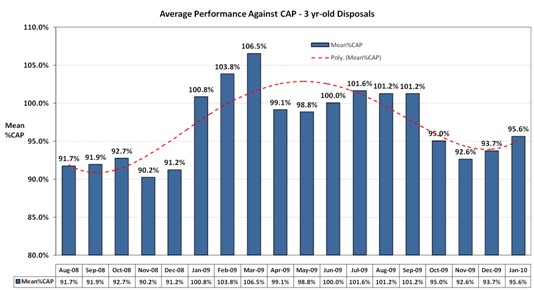
The first week’s trading saw an average performance against CAP of 100.7% for 2006 56 vehicles, although one must consider the sales channel when interpreting this figure, as the lack of physical auctions in this period, combined with the weather, meant those companies with an on-line disposals channel were reaping the rewards.
This figure dropped to 95.8% for the trading week commencing 4th January and hovered around the 95 - 96% for the remainder of the month, giving a whole month average of 95.6% CAP for the 3,268 2006 56 plate sales collected by CAP, an increase of 1.9% over December’s disposals, as shown in chart no.1.
Dealer feedback suggests fewer dealers were actively de-stocking in December, no doubt partly caused by the widespread expectation that used values would rise in the New Year.
However, the unexpectedly severe spell of weather undoubtedly then reduced showroom footfall and retail sales, meaning those dealers already stocked up had a reduced need to replenish empty forecourt spaces.
So what does this recent market performance mean for values in February’s CAP Black Book?
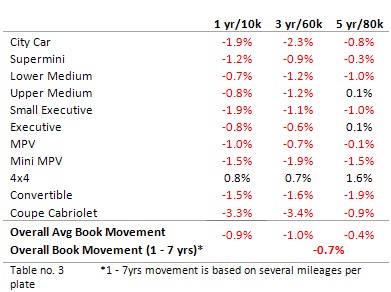
The somewhat lower than expected performance against CAP, combined with the positive dealer and leasing survey feedback meant the average 3y/60k movement was -1.0%, slightly greater than depreciation seen in February 2008 and 2009, although a typical seasonal movement once these years are discounted.
Values for a typical 3yr old car at 60,000k are still high in comparison to this time last year, with values having increased by 20.8% over the past 12 months.
Although only the 4x4 sector at 3yr/60k increased going into February, up 0.7%.
The 4x4 sector had a remarkable recovery in values throughout 2009 and undoubtedly was the only sector which would have seen sales boosted by the heavy snow experienced at the start of January, as illustrated by Land Rover’s performance against CAP for January, which averaged 104.1% CAP for sales of 2006 56 plate vehicles, a performance only bettered by Bentley, Mini and Aston Martin.
A clear trend has become apparent over the past few months,with Diesel outperforming all other non-hybrid fuel variants, with, for example, diesel 2006 56 disposals achieving a mean 96.3% CAP, 3.1% stronger than petrol’s 93.2%.
Whereas hybrid vehicles have, after a period of underperformance in 2009 done, slightly better in January, achieving an average 97.3% CAP.
Black Book February 2010 - Average Value Movements


Login to comment
Comments
No comments have been made yet.