
Private buyers and company car users have been migrating away from the traditional mainstream market, occupied by manufacturers such as Ford, Vauxhall and Peugeot, to more premium badges – that much is clear from the Society of Motor Manufacturers and Traders (SMMT) market share statistics.
But a dive into the underlying statistics we hold exclusively on the AM100 show the UK’s 100 biggest dealer groups are also moving in the direction of premium franchises.
The accompanying charts show the percentage share of premium brands’ total network held by the top 20 and by the whole of the AM100, and how much it has changed over the past 10 years.
If you want to represent Aston Martin, Audi, Jaguar, Land Rover, Mercedes-Benz or Porsche, then the graph, right, makes it clear that you must have the scale represented by the AM100. Although BMW and Mini have yet to achieve 100%, there are very few holding those franchises outside the AM100.
Premium brands have claimed to AM on several occasions over the years that they prefer a smaller number of franchisees, each with larger representation, simply because it is less complex for the national sales company to deal with fewer investors when it wants to roll out a new programme or corporate identity update.
Yet manufacturers learned there was a limit to that scale after the 2008 recession caused tremors at Pendragon, which, in the last decade, owned a third of Jaguar’s UK dealerships and accounted for almost a quarter of its annual sales. That level of representation has since reduced.
Similarly, AM100 group leaders often argue that representation at scale makes their voice more likely to be listened to by the NSC, because the relationship, and the sales volume, means much more.
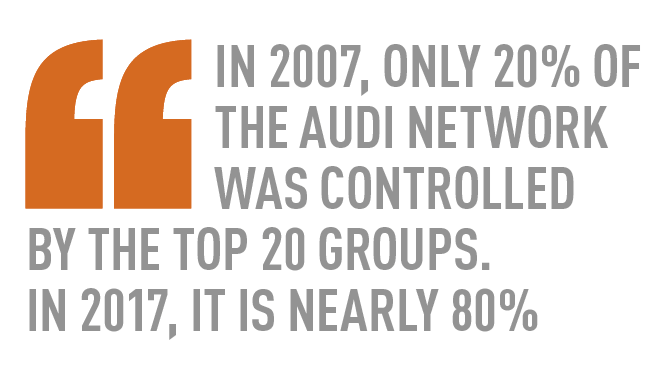
It would seem that sheer scale is not the sole criterion, although for some franchises it has clearly become the most important one. As you will see on the chart overleaf, in 2007, only 20% of the Audi network was controlled by the top 20 groups. In 2017, it is nearly 80%. Mercedes-Benz went from 57% in 2007 to 72% in 2017; Porsche from 44% vs 63%.
BMW and Mini currently have 50% of their network in the hands of the top 20, up from about 35% in 2007.
For the remainder, it would seem that scale is less important than the quality of representation that I traditionally associate with smaller ‘local heroes’.
This emphasis on scale could be considered logical – the investment required by premium franchises is substantial.
Through Jaguar Land Rover’s ongoing network restructure we have seen a number of their smaller franchisees face the dilemma of whether to borrow many millions of pounds to fund the new ‘Arch’-style showrooms or to sell up to a larger group. Many have chosen the latter.
As I have pointed out in just about every AM100 commentary since records began, scale is no guarantee of profitability.
It is true that a large group making a modest return generates a sizeable quantity of cash every year. Just take a look at the table showing profit before tax (PBT) on Page 12. However, that cash is neither a guarantee of resilience (although it helps), nor that investment in facilities will always be the top priority.
Perhaps more significantly, scale is not a guarantee of superior customer service.
Selecting larger groups to represent your franchise is a challenging balancing act. Financial resilience and ability to invest must be weighed against risk to the brand of less of the personal commitment to brand values that comes with smaller groups that have fewer competing priorities.
This apparent shift in strategy, both on the part of the prestige carmakers and those groups who have made a deliberate move to represent prestige more and volume less, has not had a uniformly beneficial outcome on profitability.
The top 20 by return on sales (RoS%) contains only two of the top 20 groups by turnover.
Arnold Clark’s success has been consistent over the long term and reflects not the franchises it represents, but its way of doing business, in that it dominates its heartland and is operating its own businesses in all divisions from franchised sites and rental and leasing through to used car supermarkets and motor finance.
Sytner, holding a largely prestige portfolio, has done so since inception (original owners Frank and Alan Sytner took BMW as their first franchise in 1970) and consistent RoS may also be more attributable to its operating style than perhaps its franchise mix. It invests in good businesses, engaged people, systems and facilities.
The rest of the RoS top 20 are a mix. There are some groups largely or wholly prestige. But then there are groups largely or wholly non-prestige. In fact the balance is about 50-50.
It isn’t about geography either – there are groups from the North, the South, the extreme South-West, from Wales, from East Anglia.
If you examine the previous year’s RoS table, the same names are present, so my overwhelming conclusion is that it is how you do it, not where or with what.
There is a new leader of the RoS% top 20 table. Hatfields, with 3.8%, displaces the long-time leader, CEM Day. CEM Day also makes 3.8%,
but came second on count back. However, it made 4.4% last time and its history of success is evident down the years in the table.
Only four groups exceed 3% this time, versus eight last time. All of the top 20 exceeded 2% last year, but only 18 did this time.
It would seem that 2016 has been a tougher year and, anecdotally, the pressure to make volume and margin has continued into 2017.
PIERS TRENEAR-THOMAS
| Rank 2017 | Group | RoS% | Rank 2016 | Group | RoS% | Rank 2015 | Group | RoS% |
|---|---|---|---|---|---|---|---|---|
| 56 | Hatfields | 3.80% | 63 | CEM Day | 4.40% | 58 | CEM Day | 4.04% |
| 64 | CEM Day | 3.80% | 31 | Glyn Hopkin | 3.80% | 3 | Arnold Clark Automobiles | 3.29% |
| 4 | Arnold Clark Automobiles | 3.40% | 77 | Yeomans | 3.30% | 73 | Hatfields | 2.90% |
| 52 | Porsche Retail Group | 3.30% | 4 | Arnold Clark Automobiles | 3.30% | 23 | Helston Garages Group | 2.87% |
| 59 | Peoples | 2.70% | 51 | Porsche Retail Group | 3.20% | 77 | Yeomans | 2.59% |
| 48 | City West Country | 2.60% | 69 | Hatfields | 3.20% | 52 | Westover Group | 2.51% |
| 1 | Sytner Group | 2.50% | 64 | City West Country | 3.10% | 67 | Eden Motor Group | 2.47% |
| 79 | Steven Eagell | 2.50% | 52 | Hartwell | 3.00% | 22 | Harwoods | 2.43% |
| 76 | Yeomans | 2.40% | 24 | Helston Garages Group | 2.80% | 88 | John Grose Group | 2.42% |
| 33 | Super Group UK | 2.30% | 97 | Fish Brothers | 2.60% | 2 | Sytner Group | 2.42% |
| 23 | Helston Garages Group | 2.20% | 92 | Steven Eagell | 2.40% | 46 | Allen Ford | 2.34% |
| 28 | Dick Lovett Group | 2.10% | 2 | Sytner Group | 2.40% | 74 | Currie Motors | 2.29% |
| 36 | Peter Vardy | 2.10% | 53 | Eden Motor Group | 2.40% | 64 | City West Country | 2.22% |
| 69 | Stephen James Group | 2.10% | 76 | Lifestyle Europe | 2.30% | 79 | Lifestyle Europe | 2.21% |
| 42 | Robinsons Motor Group | 2.00% | 29 | Peter Vardy | 2.30% | 63 | Peoples | 2.13% |
| 82 | John Grose Group | 2.00% | 59 | Peoples | 2.30% | 35 | Dick Lovett Group | 2.10% |
| 86 | Bestodeck | 2.00% | 35 | Dick Lovett Group | 2.30% | 4 | Lookers | 2.05% |
| 34 | Glyn Hopkin | 2.00% | 48 | Westover Group | 2.20% | 42 | Lloyd Motors | 1.99% |
| 100 | L&L Automotive Group | 1.80% | *Acq | Ridgeway Group | 2.10% | 44 | Robinsons Motor Group | 1.93% |
| 45 | Westover Group | 1.80% | 42 | Robinsons Motor Group | 2.00% | 33 | Spire Automotive | 1.92% |


Login to comment
Comments
No comments have been made yet.