
Dealers have faced unprecedented challenges this year, but the hurdles coming into view in the next 12 months could be just as difficult to overcome – a legacy of extraordinary market conditions and the scrappage scheme which was so sorely needed to boost to consumer and retailer confidence.
This year hasn’t been quite as bad as everyone was expecting. But there are a number of factors distorting the true picture of the market.
While the scrappage scheme hasn’t been an instant profit driver for dealers it has benefited the industry greatly.
VAT being cut to 15% has also helped. But scrappage will end, VAT returns to 17.5% on January 1 – and a new showroom tax is being introduced from April 1.
In fact, many believe next year will be the year everyone feared 2009 would be.
Auto Trader has put together a far-reaching survey compiling statistics from the SMMT, CAP, BCA the Bank of England and its own figures.
Tim Peake, Auto Trader commercial director, explains the reasons behind the automotive recession and what’s likely to happen in 2010.
The new car market
New car registrations are expected to be down 10% this year at 1.928 million units. This forecast is confirmed by understanding the relation between UK home loans and new car registrations (chart A below).
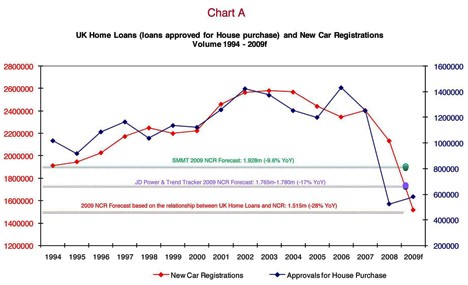
Year-to-date to November new car registrations are down 12.3%. Without the scrappage scheme this decline would have been closer to 24%.
Peake said: “Forecasting registrations without the scrappage scheme shows a 24% decline so it’s undeniable its implementation is helping sales in the short term.”
Scrappage scheme sales have been mostly incremental and a lot of them will not conform to the typical replacement cycle of 3.5 years.
Based on a new car registrations forecast of 1.928 million, the new car market would be down by 20% in comparison to pre-recessionary Britain in 2007.
The combined impact of declines in 2008 and 2009 is a loss of 480,000 new cars in the market. That also means bad news for the used market as that same amount is lost and can never come back to be transacted in the next five years.
Previous recessions
The recessions of 1979/80 and 1991/92 also took a massive toll on the automotive industry, falling by 25% and 21% respectively. This further reinforces the dire state the market would have been in without the scrappage scheme and another reason for dealers to brace themselves for a difficult 2010.
After previous recessions it took six years to recover to pre-recession levels. So while some analysts are predicting a 2012 recovery for the UK’s economy, it’s going to take much longer for the automotive industry to get back to where it was before the economy crashed.
Excess stock
There was an oversupply of production between April and July in 2008 (chart N below) caused by manufacturers’ inability to slow production as quickly as the dive in the UK economy.
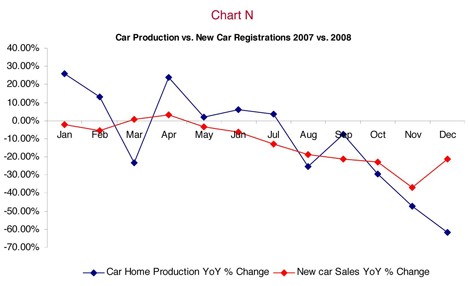
Peake said: “The over-capacity of new cars in the market led to the decline in used car prices, which fell by 18% in 2008 in comparison to 2007. In some months during 2008 cars were declining in price by as much as £300.
“As manufacturers managed to limit the supply of stock, car production was severely impacted and a shortage of stock through early 2009 started to materialise. This cut in supply became more severe than the reduction in new car registrations.”
However, as the dramatic fall in prices had occurred throughout 2008, new cars became “relatively” good value for money as compared to all other goods and services in the UK.
The top graph in chart R (below) shows the dramatic fall in household consumption throughout 2009, clearly showing that overall consumer demand is weak and is forecast to stay weak until Q1 2010.
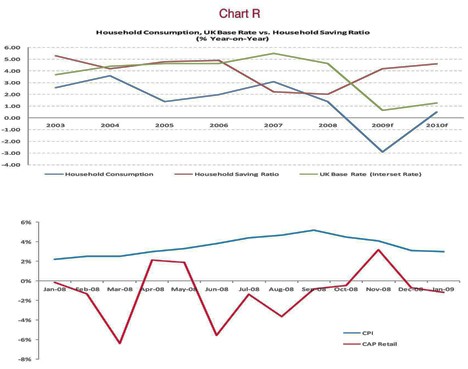
However, consumers with disposable income, while significantly less than in previous years, were willing to purchase cars given the good value of new and used cars (chart R shows the value gap for cars versus all other consumer goods and services).
The first quarter of 2008 – the period which showed car spend as a contribution to quarterly growth – was already down, marking the start of the automotive recession.
Peake said: “This is unsurprising given the relationship between demand in cars and availability of credit. However, as outlined earlier, manufacturers did not reduce production until August 2008 – eight months of oversupply.”
Price rises in 2009 (chart T below)
Peake believes the undersupply in production towards the end of 2008 has been a far greater contribution to price rises this year.
Auto Trader prices historically correlated to both CAP and BCA. However, this correlation ended in December 2008.
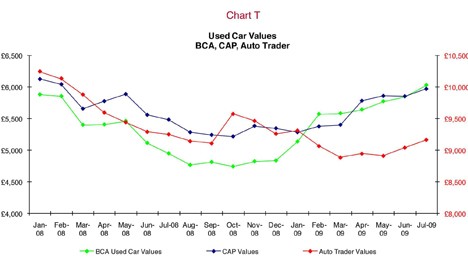
Peake said: “For the first five months of 2009 advertised prices on Auto Trader declined.
“This is a clear indication the trade, in its attempt to gain stock, was pushing prices up in the overall market, but the consumer market was still weak and so advertised prices declined.”
This is a key point for manufacturers to consider when planning production volumes for next year. The recent price rises are not due to an “absolute” strong consumer demand, but to a shortage of supply and only a “relatively” strong consumer demand.
Dealer margins squeezed
The impact of price rises and the shortage of supply hit dealer profitability. The shortage of stock for dealers led to them pushing prices up, which they couldn’t immediately pass on to consumers.
Peake said that if the Auto Trader price had continued to follow CAP and BCA it would have expected to see an increase in dealer profitability, but this didn’t happen.
Peake said: “Likewise, when we started to see increases in the Auto Trader price, we saw an improvement in dealer profitability in May, June and July 2009.
“Again showing that ‘relative’ consumer demand allowed for some price inflation in vehicle sales (helped by volume driven via the scrappage scheme).”
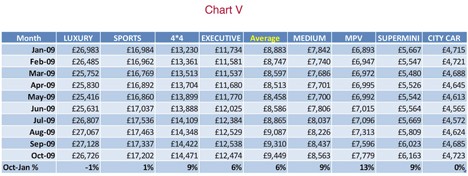
What to stock? (chart W below)
Peake said: “It would seem the scrappage scheme has impacted prices at both ends of the spectrum.
“Prices for cars aged six years or older decreased through the year by up to 4%. Dealers more than likely were forced to reduce prices in the age bracket given the £2,000 reduction in cars of 10 years or older. The price falls at the other end of the market are most noticeable with one year old cars’ 13% reduction in prices.”
The gap between searched prices and advertised prices is widening which means consumers are still looking for cars valued at the same price as in January 2009 and not prices driven as a result of increased trade activity.
Peake said: “The key point is that those dealers who more closely reflect searched for prices in their sales price should see improvements in volume of sales and responses.
“Relative to other car segments there is a potential opportunity for those dealers stocking medium and MPV car types to increase prices. However, it is true that all car segment prices are higher than searched for prices by consumers.”
Finally, dealers have an opportunity to price and stock those cars that are most popular in different regions. Chart Z provides dealers’ data that should help maximise response / sales by pricing to volume of demand by consumers by region.
Peake said: “Buying the right stock is crucial to dealer profitability. For example if you were located in the Midlands and acquired a Mercedes-Benz 180 you would have bought a car that has the most searches per advert (i.e. 191 consumers looking at every Mercedes Benz 180) vs 14 consumers searching for a Vauxhall Nova.”
- For more information contact Tim Peake at tim.peake@tradermedia.co.uk or Karolina.smajda@tradermedia.co.uk.


Login to comment
Comments
No comments have been made yet.