

Anyone who relies on the auction as their main route for vehicle disposal must have been wondering in recent times just how low the reserve needs to be to get the sale.
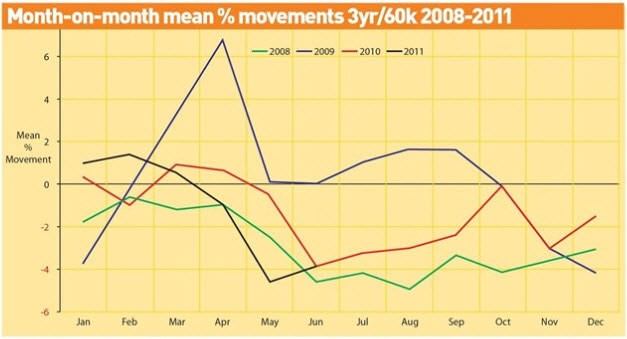
And in general, the lack of confidence in the market at the moment will have also been likened by many to the darker days of 2008 when values at 36 months 60,000 miles fell an unprecedented -34.6% over that year in total.
The fact is, it is very difficult to describe the present day market without using negative terms.
Although auction houses and other remarketing specialists have reported some slight increases in conversion rates, the figures are still less than the average expected for the time of year.
And even with sellers lowering their value expectations to below CAP, in recognition of a sometimes fast-moving market this has more often than not still failed to stimulate the production of a buyer’s cheque book.
Consequently the past month saw values dropping on average -3.8% at 36/60 which is above the expected norm for June and reflects how tough the market really is.
The comparisons with 2008, while tempting, are slightly wide of the mark. Where it does fit is in the dynamic of supply outweighing demand and some manufacturers doing more than a little short cycle business.
We are also still in an economically fragile environment and there has been another reminder of the impact of rapidly escalating fuel prices.
Finally – to complete the ‘perfect storm’ scenario – there is also a lack of retail hunger. But values have not plummeted to nearly the same extent and nor are they likely to.
Last month saw the biggest reduction in Black Book values at 36/60 since August 2008 but this should not be viewed in isolation.
Afterall, 2009 saw annual depreciation at 36/60 replaced completely by an appreciation of +3.4% overall.
One small but significant change in dymanic this year, for example, came from the choice by many manufacturers to introduce list price increases alongside this year’s VAT rise.
This inevitably widened the used to new gap slightly and therefore pushed the attention of more consumers toward used vehicles.
Going back to look specifically at June 2008, the overall movement at 36/60 was -4.5% but the scale of what followed was staggering.
Between July and December, the values of an average vehicle at this point fell a further -23%, or to put in perspective nearly 14 months depreciation in just 6.
The first 6 months of 2009 demonstrated just how low values were when between January and May where normal depreciation would have been -5.2% year to date, the figure was actually +6.2% and the few people who did opportunely harvest when the time was right did indeed reap the benefits.
2009 brought a return to fruition for most people with some dealers recouping the losses from the previous year, typical seasonal movements were washed away as manufacturers slowed down production and demand started to outweigh supply in a lot of cases.
The year would end with overall values appreciating, and in the case of the hardest hit sectors in 2008 these would bounce back even stronger as consumers saw relative value for money in some vehicles.
2010 values ended overall at 36/60 falling -16.6% which is fairly typical depreciation for 12 months and we began to see some return to normality.
At CAP we maintained certain values within specific sectors were still over inflated and would inevitably realign at some stage.
What all this suggests is that an eye should always be maintained on the bigger picture.
And the bigger picture shows us that values are still, in many cases, some way ahead of where they were before the tumultuous events of 2008/09.
Seen in that context, we are certainly not yet out of the woods in terms of price stability.


Login to comment
Comments
No comments have been made yet.