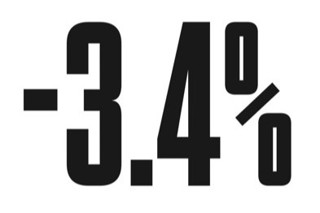
The UK was the only market from the big five in Europe to see a decline in new car registrations over the first half of this year.
Figures from JATO Dynamics show the overall European new car market increased by 1.9% to 1.5 million units in H1. However, the UK saw a 1.3% decline, compared with increases of 8% in Italy, 7.1% in Spain, 3.1% in Germany and 2.6% in France.
Felipe Munoz, global automotive analyst at JATO Dynamics, said: “Overall, the market is looking healthy in Europe, with the strongest H1 performance since 2007.
“In particular, the Central and Eastern European markets have grown strongly this year and with some of them recording record levels of employment this trend looks set to continue.
"However, it’s notable that the UK is experiencing a slowdown in registrations which can be attributed to uncertainty about the nature of the country’s exit from the EU.
"Until there is clarity over how Brexit will work and what the UK’s relationship with the EU will look like, the UK market may continue to decline, while the rest of Europe continues to grow.”
VW Group’s market share decreased – it fell from 23.7% in H1 2016 to 23.3% in H1 2017. This was the second highest fall in market share, only PSA experienced a larger decline with its market share declining by 0.6 percentage points of share
The market continued to be driven by SUVs like the VW Tiguan and Peugeot 3008. In the compact segment, the VW Golf leads, but its volume for H1 2017 fell by 11.6%, while the Renault Megane experienced growth of 32.7%.
| H1-17 | H1-16 | Var. | Jun-17 | Jun-16 | Var. | |
|---|---|---|---|---|---|---|
| H1 | Jun | |||||
| 16-17 | 16-17 | |||||
| Austria | 186,561 | 171,770 | 8.60% | 35,441 | 33,751 | 5.00% |
| Belgium | 322,301 | 309,605 | 4.10% | 55,118 | 55,272 | -0.30% |
| Croatia | 31,982 | 25,728 | 24.30% | 6,797 | 6,142 | 10.70% |
| Czech Rep. | 144,452 | 132,780 | 8.80% | 26,634 | 25,714 | 3.60% |
| Denmark | 123,945 | 116,921 | 6.00% | 23,989 | 23,645 | 1.50% |
| Estonia | 13,707 | 12,080 | 13.50% | 2,728 | 2,022 | 34.90% |
| Finland | 64,407 | 65,415 | -1.50% | 10,862 | 10,750 | 1.00% |
| France | 1,130,578 | 1,102,147 | 2.60% | 229,757 | 227,273 | 1.10% |
| Germany | 1,787,026 | 1,733,839 | 3.10% | 327,693 | 339,563 | -3.50% |
| Greece | 50,309 | 47,367 | 6.20% | 10,135 | 8,847 | 14.60% |
| Hungary | 54,810 | 46,056 | 19.00% | 10,820 | 9,714 | 11.40% |
| Ireland | 91,190 | 101,329 | -10.00% | 1,397 | 1,624 | -14.00% |
| Italy | 1,136,395 | 1,052,411 | 8.00% | 188,037 | 167,195 | 12.50% |
| Latvia | 8,618 | 8,698 | -0.90% | 1,591 | 1,937 | -17.90% |
| Lithuania | 12,794 | 10,688 | 19.70% | 2,672 | 1,899 | 40.70% |
| Luxembourg* | 28,078 | 28,315 | -0.80% | 4,338 | 5,106 | -15.00% |
| Netherlands | 226,431 | 194,808 | 16.20% | 41,167 | 39,431 | 4.40% |
| Norway | 79,332 | 78,998 | 0.40% | 14,634 | 14,047 | 4.20% |
| Poland | 248,020 | 210,711 | 17.70% | 41,881 | 38,555 | 8.60% |
| Portugal | 127,186 | 118,626 | 7.20% | 24,834 | 23,369 | 6.30% |
| Romania | 45,008 | 35,452 | 27.00% | 8,030 | 5,462 | 47.00% |
| Slovakia | 48,588 | 43,771 | 11.00% | 9,543 | 8,302 | 14.90% |
| Slovenia | 39,032 | 34,980 | 11.60% | 7,555 | 6,492 | 16.40% |
| Spain | 673,535 | 628,957 | 7.10% | 133,371 | 125,181 | 6.50% |
| Sweden | 193,530 | 187,591 | 3.20% | 38,324 | 36,307 | 5.60% |
| Switzerland | 157,569 | 157,388 | 0.10% | 31,509 | 31,093 | 1.30% |
| UK | 1,401,811 | 1,420,636 | -1.30% | 243,454 | 255,766 | -4.80% |


Login to comment
Comments
No comments have been made yet.