
While 2016 was all about record registrations, acquisitions and a foretaste of challenges to dealer margins, in this year’s AM100 the overriding concern seems to be preserving as much of those profits as possible.
Even last year, while new car registrations and the total turnover generated by the AM100 member groups were at record levels, profitability, as measured by return on sales (RoS) was showing signs of stress. Some groups still produced admirable results, but there was an overall decline from the position of strength in depth seen in the previous two years.
The headline message of last year’s AM100 analysis was ‘Car dealers should fix the roof while the sun shines’. Well, it would seem that expert roofers have been in short supply. It is difficult to see substantial change in many of the AM100 indicators, biased as it is towards scale, but it is quite clear that profitability has declined.
The fall in return-on-sales
Its ‘one-stop shop’ approach still puts CEM Day at the head of the RoS table, at 3.4%. However, this is below last year’s result (3.8%) and a full point below its record of 4.4% in 2015. The rest of the top 20 by RoS have also suffered in 2017. The entry point to the table is now 1.4%, where previously it has been more than 2%. In fact, this is the lowest entry point since profitability became one of the AM100 measures.
 The responses to the questions in the AM100 information-gathering circular about profitability have also been largely pessimistic. The challenges posed by lack of new car demand (for a variety of reasons) and rising costs figured frequently.
It is interesting, then, to consider the acquisition strategies hinted at by the activity of the past two years. Last year was arguably a record year for acquisitions. This time around, there have been some sizeable transactions, but they are quite different in both number and type.
During 2016 and in the run-up to the Spring 2017 AM100, there were about 17 major transactions, versus half a dozen or so in the remainder of 2017 and 2018 to date.
This time, the majority of active acquirers have foreign ownership – Sytner/Penske, Group 1/UAG, Allen/Super Group, Pentagon/Motus for example.
Shifting acquisition strategy
While some of the acquisitions have gone towards fulfilling what may be considered routine ambitions of scale, there is a new strategic direction about a couple of them. Sytner followed its acquisition of used car group CarShop by adding The Car People. And Hendy Group very recently acquired Unbeatable Car’s site in Portsmouth.
A number of groups have shifted their focus towards used cars, but only Sytner has made two large acquisitions in the sector. Some might say the increase in the attention paid to the used car market is long overdue.
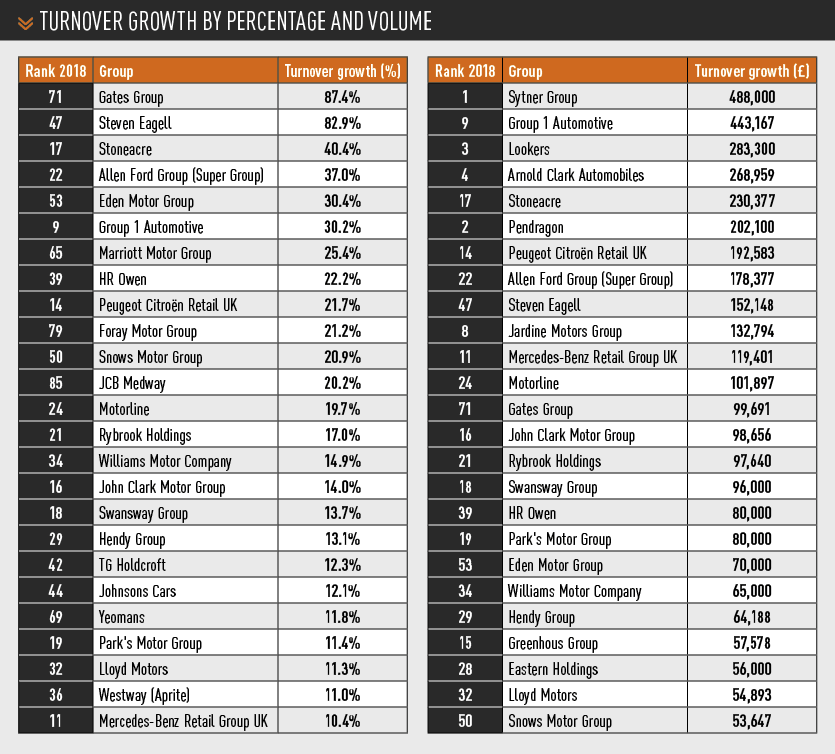
 Somewhat below the radar are a number of ‘rearrangements’ that fulfil manufacturer network realignment plans. Some of the largest-scale increases in percentage terms are from groups benefitting from network partner or geographical realignment, such as Gates Group acquiring sites from TrustFord, Steven Eagell acquiring Toyota and Lexus sites from Jardine, (and in previous years, from Lookers and Marshall), and Stoneacre taking a selection of franchises from Burrows, Variava and Platts.
While its profitability has clearly declined, it is less clear that the acquisition and network ‘rearrangements’ have changed the landscape much. Despite the decrease in total industry volume (TIV), the AM100 has turned in a new record for total turnover of more than £67bn. The entry threshold has risen to £132m. The big are getting bigger and the acquisition of smaller AM100 groups is pulling in new entrants and raising the threshold – gradually, the AM100 is gaining weight.
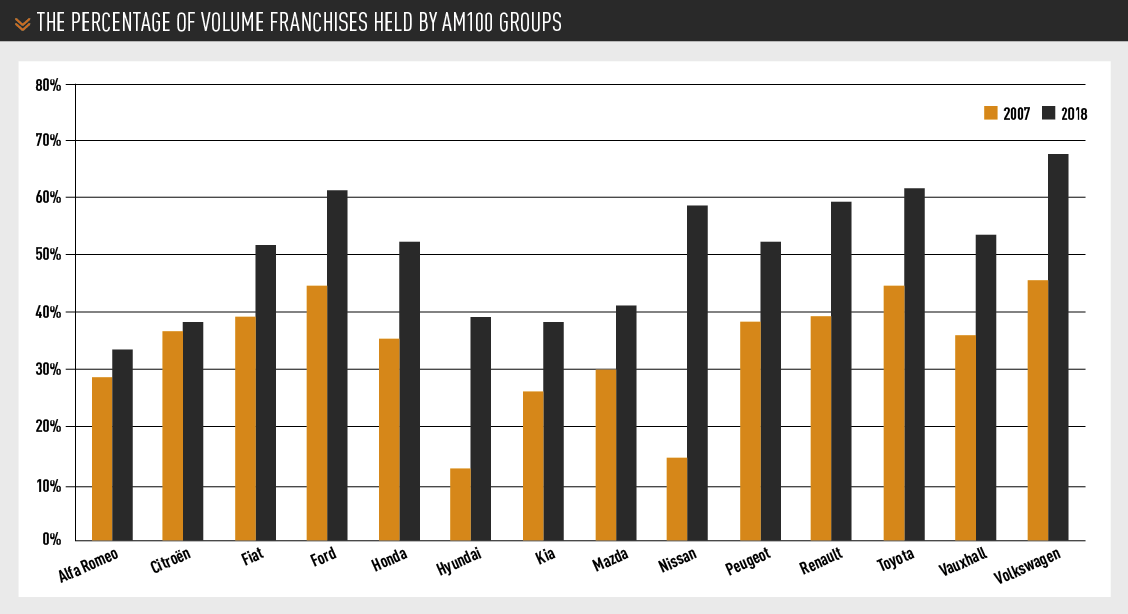
For many years, regardless of apparent consolidation, there actually was none. The share of TIV accounted for by the AM100 remained at about 50%. Finally, in the past two or three years, this has risen to 58%.
 It is likely that this is actually more due to some brand realignment by volume franchises (whether this is by design on the part of the manufacturer or of AM100 groups is not clear) than to acquisitions, but regardless of the source this picture has changed. The chart above shows that in the past 10 years the percentage of volume franchises held by AM100 groups has increased significantly. This is of course particularly true of those brands, such as Nissan, who own their own dealer groups.
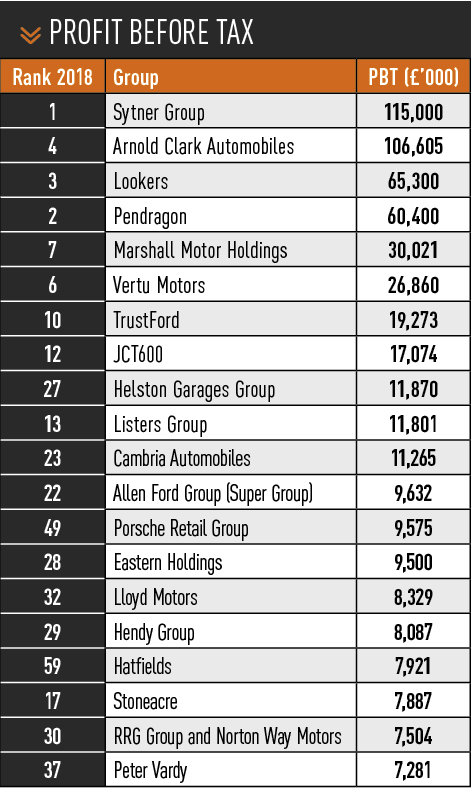
One further scale record is worthy of mention. Sytner at top of the AM100 table with turnover of £5.8bn, has substantially exceeded the previous scale record held by Pendragon (£5.1bn – 2007). Shortly after that, Pendragon substantially reduced in size, in part because of the recession, but perhaps also because the expansion strategy became unsustainable. Sytner’s rise is due in no small part to the two acquisitions of major used car specialists. For reasons now explored below, this may well represent a much more sustainable growth strategy.
The aversion to used sales
This strategy, and the attention other groups have paid to the used sector, has moved the dial marginally.
However, the ratio for of new:used sales of the AM100, at a mere 1:1, is still well below what would represent proper attention to the sector.
This is curious. Commentators have, for years, speculated about the apparent reluctance of franchised dealers to make the most of the used car sector.
The results of groups who specialise in used cars can be spectacular (by comparison with franchised dealers). AM’s ID50 survey of the UK’s 50 biggest independent dealers by turnover shows RoS results ranging up to a high of almost 10% for traditional used car dealers, with some classic car dealers reaching more than 15%. The entry point for the ID50 top 20 dealers by RoS is 2.8%, exactly double that of the corresponding table in the AM100 (1.4%).
 A recent KPMG survey included in its findings that “the only means for dealers to survive is by restructuring into a service factory or a used car hub in the future”. If this is so, why are only a small few making significant moves to improve their used car operations?
The new car market available to dealers amounts to some proportion of TIV. With TIV at about 2.5m units and likely to stay that way for a while if we are, as some suspect, at ‘peak car’, at least in conventional ICE terms, that is a maximum of fewer than 2m units.
The used car market is at least four times that (8.1m units in 2017), even allowing for consumer-to-consumer sales that go nowhere near a dealer.
So why limit yourself to a fraction of the available market place? It makes no sense.
If you conclude that the proportion of TIV available to dealers will increasingly exclude fleet, then the equation becomes even more stark.
And what about aftersales? If we are at peak car, the segment of the parc currently served by AM100 dealers will be declining. With increased reliability, different types of vehicle (e.g. electric), competition from independents etc., the available hours per unit of that declining parc segment will also be declining.
This leaves a simple choice. Increase used car sales, penetrate the (older) parc segments that are still growing. And increase retention. Or sooner or later, fail.
PIERS TRENEAR-THOMAS
Notes on the AM100
• Information in the AM100 is derived from responses to our questionnaire or from statutory accounts. Where no questionnaire has been returned and statutory accounts are not sufficiently current, an estimate is made.
• Profits are adjusted, where information is available, to eliminate exceptional items. Profit percentages are calculated on the unadjusted turnover numbers. Turnover is net of VAT.
• In order for the table to be as current as possible, information in the public domain, principally relating to acquisitions and disposals, is used to update questionnaire responses or statutory accounts.


 and chairman Peter Vosper")


 production line")


Login to comment
Comments
No comments have been made yet.