
The magnitude of last year’s used car trade price collapse is starkly highlighted by recent analysis at CAP.
And one of the most revealing aspects of the severity of the 2008 downturn is that despite this year’s reversal in fortunes, not all of the lost ground has yet been made up.
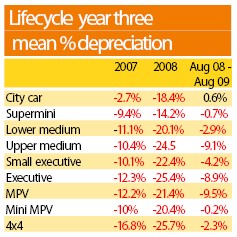
CAP analysts examined average depreciation by sector, comparing the periods of 2007, 2008 and the 12 month period between August 2008 and August 2009.
The patterns of depreciation during 2007 reflect trends already well established, roughly translating to the more economical, the lower the depreciation.
Therefore the smallest vehicles saw the lowest average depreciation during 2007.
Price reductions in this, the last ‘normal’ year in the used car market, were clearly linked to economy.
Significantly, the seeds of the accelerated decline in 4x4 values were already apparent in this year too, but that is a phenomenon that was already attracting widespread comment before the near-total collapse of that market in 2008.
Where the figures become interesting is in the downturn of 2008. The resilience of city cars prior to the downturn had clearly left them looking “exp-ensive” and therefore subject to more price pressure than their slightly larger supermini cousins.
Therefore they lost an average 18.4% during 2008, compared with 14.2% for superminis. This, in turn, left them looking very attractive in terms of value for money, which stimulated very
significant additional demand.
Consequently city cars proved the only sector to see increased average values in the 12 months following August 2008.
Aside from that initial departure from the “smaller cars = strongest price resilience” rule, the figures tell an unsurprising story of pain increasing with front-end cost and engine size during 2008.
And that is a lesson that will surely now stick, especially if the market ever returns to the more typical supply-led model.


Login to comment
Comments
No comments have been made yet.