

2008 and 2009 continues to be a tale of two halves and you’d have to be squirreled away in some dark corner of the industry not to be aware just how significantly the market has changed over the past year.
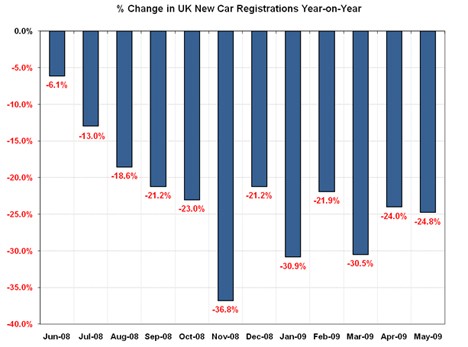
Despite levels of new car sales peaking in 2003 at 2.579 million units, it wasn’t until the middle of last year that new registrations began their rapid decline (see chart no. 1 which shows the year-on-year % change in new registrations over the past twelve months).
So what happened? Rather than being attributable to any singular event one has to consider the manufacturers’ business model and how sustainable that model was in a recessionary climate.
Pre-, Self- or Forced- , whichever prefix you choose to use, the reasons for self-registration are many; the need to keep factories busy, avoid new car stockpiles, chase market share or hit dealer targets or volume bonuses all contributed to the over-supply of new cars into the UK market.
In a recessionary climate when big-ticket purchases such as cars are often the first casualties this over-supply was definitely unsustainable, particularly when the decline in Sterling exchange rate affects the return per unit for oversees manufacturers.
Chart 1
More realistic sales figures
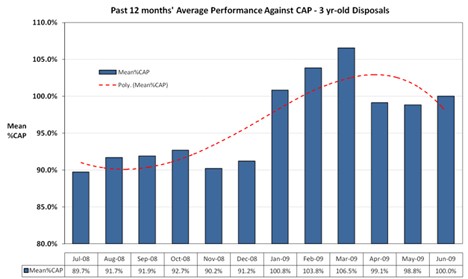
This shift to a more realistic level of new car sales has undoubtedly been a contributory factor in the remarkable rise in Used Values seen this year. Chart no. 2 shows the average disposal performance of 3 yr-old cars as a percentage of CAP Black Book ‘CAP Clean’ values.
As 3yr-old models will invariably require an element of reconditioning before being ready to retail, any performance of over around 96 - 97% represents underlying trade values on the increase. As you can see, used sales this year have seen a massive swing from the poor performance that typified 2008.
Chart 2
More cost effective means of changing cars
As new car sales fell, buyers looking for a more cost-effective means of changing car meant more dealers found themselves chasing the same used stock to fill the gap.
So, although conversion rates are not as high as the near 100% recorded throughout the country in March, and despite a little more selectivity returning to trade buying habits, there are still more buyers and not enough used stock.
Many manufacturers’ used stock levels have meant many closed/invitational auction programmes have had to be either severely cut back or cancelled altogether.
So what has the actual impact been on used values? The press and internet are abound with stories of specific 4x4s that have recovered £4 – 5,000 over the past six months, but many of these cases have been selected to hang a story on rather than being truly representative. But used residuals have certainly increased significantly.
Table no. 1 shows the average CAP Black Book values by Sector, based on 2006 06 and 60,000 miles, with all values based on a comparison of like-for-like models across the 11 months. As you can see 2006 06 values in some sectors have returned to last September’s levels – 4x4 values have certainly recovered the most; increasing an average £1,400 since January this year, to return to September 08’s price level.
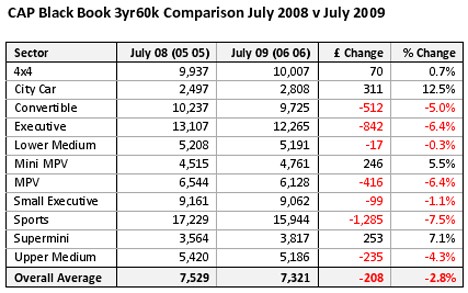
However, it is when we compare average 3yr-old values in July-09 with 3 yr-old values in July-08 that a truer picture emerges.
Table no. 2 is based on a comparison of like-for-like models and 2005 05 plates in July-08 with 2006 06 plate values in July-09, and shows that it is the smaller vehicles, City Car, Supermini and Mini MPV that are still the standount used value performers. Taking into account that an expectation of 5% depreciation for lifecycle is the norm, Supermini’s 7.1% increase shows that underlying values have increased significantly.
The key question is how far can values continue to rise? Well, most pricing models will tend to a limit, but if the current stock situation continues there may still be further increases to come.
Table 1
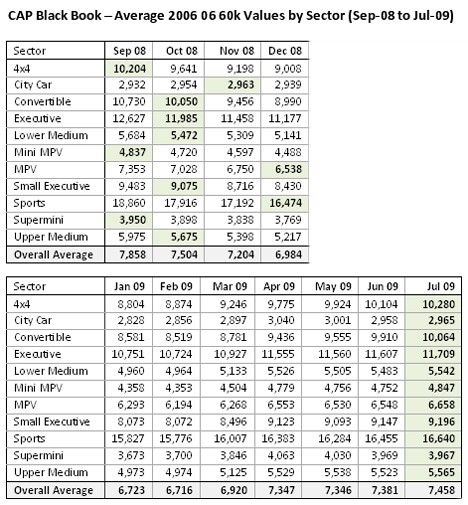
Table 2


Login to comment
Comments
No comments have been made yet.