

Almost all drivers (95.5%) cannot match the MPG figures based on laboratory-based government fuel economy tests according to What Car?'s True MPG analysis.
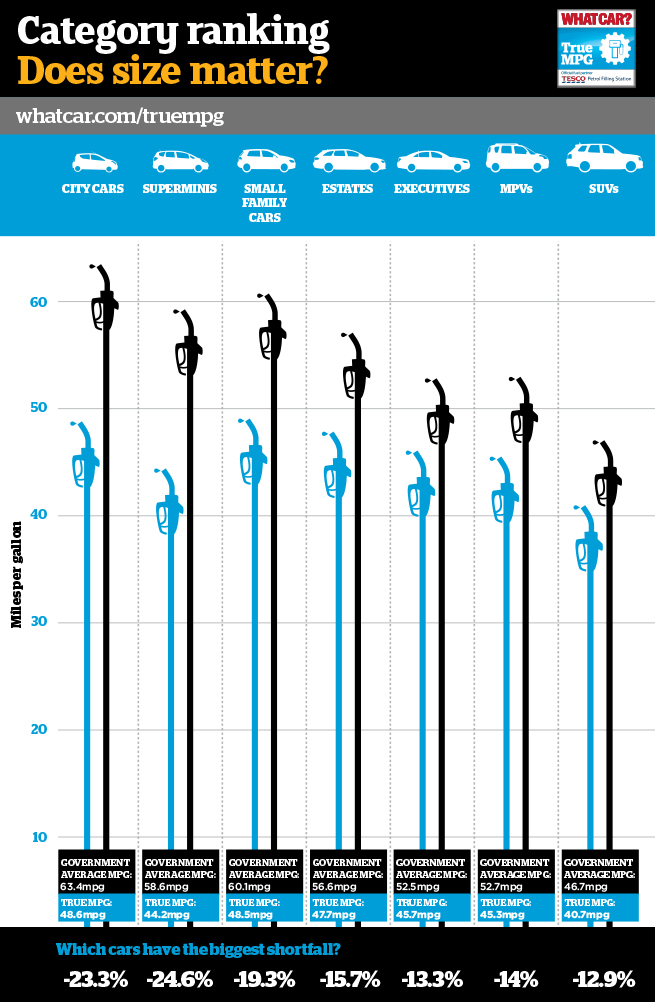
City cars and superminis showed the largest disparity between fuel economy tests and What Cars? True MPG figures. The average miles per gallon shortfall across all cars tested is 17%. SUVs demonstrated the lowest disparity.
Defining an average fuel consumption figure has always been a challenge for manufacturers and most MPG figures are used as part of a model’s marketing campaign.
There were eight models that performed better than the quoted figures, with the Mazda3 2.3 MPS displaying better fuel economy by 9.7% on average (see the full list below).
Chas Hallett, What Car? editor-in-chief, said: “We launched What Car? True MPG last April as a direct answer to the countless readers who had contacted us to say how disappointed they were with their car’s economy figure.
“Expecting high fuel economy and getting the opposite can double a household’s fuel expense.”
Models that exceeded the official published government average mpg
1 Mazda 3 2.3 MPS +9.7%
2 Peugeot 5008 2.0 HDi 150 +7.5%
3 Nissan 370Z 3.7 V6 +6.8%
4 Volkswagen California 2.0 TDI 140 +6.1%
5 Volvo XC90 2.4 D5 200 auto +3.2%
6 Volvo S60 3.0 T6 AWD 304 auto +2.9%
7 Ford S-Max 2.0 TDCi 163 auto +1.5%
8 Hyundai Santa Fe 2.2 CRDi 4WD auto +0.2%
=9 Toyota GT86 2.0 0%
=9 Subaru BRZ 2.0 0%


Mr Physics - 04/04/2013 15:17
What Car is missing the point here. What they should say is that the official mpg figs can be used as a fair comparison between different cars and manufacturers as they have been deduced under the same conditions. VMs should then of course stop claiming the official mpg as achievable so customers are not mistaken or disappointed with mpg achieved. Hybrid cars on the other hand should have a new measure as they under the laws of physics make NO SENSE at all. There is one energy source and any efficiency gained from hybrid technology is lost in carrying the bloody thing around! PSA's hybrid air system should be lighter and offer some advantage but hydrogen has to be the future long term.