
The average UK motor dealer produced a bumper result in September making a profit for the month of over £75,000, beating the 2013 performance by £8,000.
This pushed the rolling 12-month return on sales percentage back above 1.5% with the average site making £230,000 this year, according to ASE figures.
ASE chairman Mike Jones said: "Whilst this is clearly a strong result, profitability for the third quarter matched that in 2013 despite the increase in new vehicle registrations. This is a clear indication that, whilst more metal is being moved through the dealerships, profitability is static."
He also said there are signs that the increased registration pressure is feeding through to used car stocks, with total investment per site up £150,000 in September.
"Whilst we expect an increase in a registration month as a result of part exchange vehicles, the rotation of demonstrator fleets and self-registered vehicles, the rise is normally limited to £100,000.
"This increase in stocks will start to impact negatively on the used car return on investment unless the vehicles are liquidated quickly."
Aftersales performance has continued a "slow and steady" increase with overall labour efficiency rising for the 13th consecutive month.
"Whilst the increases are all small this is adding profit straight to the bottom line and brings parts profit with every hour worked."
Overall profitability for the year looks strong with all signs pointing to a record overall result.
"The rate of increase over 2013 has definitely slowed and many dealers have self registered cars to shift, however 2014 should still produce a return of £230,000 per site on average."
ASE September performance stats
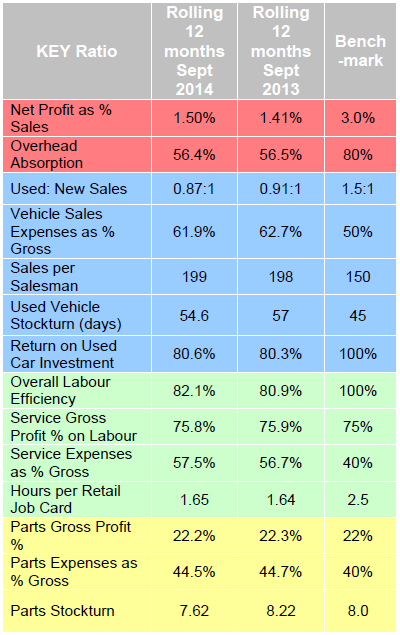
ASE rolling performance stats for 2014
| Key ratio | Benchmark | Mar-14 | Apr-14 | May-14 | Jun-14 | Jul-14 | Aug-14 | Sep-14 |
|---|---|---|---|---|---|---|---|---|
| Average dealership profit | £96,000 | £9,000 | £5,000 | £31,000 | £3,800 | -£15,000 | £75,000 | |
| Net profit as % of sales | 3.00% | 1.55% | 1.55% | 1.52% | 1.54% | 1.51% | 1.48% | 1.50% |
| Overhead absorption % | 80% | 57% | 57.90% | 56.10% | 56.50% | 56.40% | 56% | 56.40% |
| Used: new sales | 1.5:1 | 0.88:1 | 0.88:1 | 0.87:1 | 0.87:1 | 0.87:1 | 0.87:1 | 0.87:1 |
| Vehicle sales expenses as % gross | 50 | 61.7 | 61.6 | 61.7 | 61.6 | 61.68 | 61.9 | 61.9 |
| Sales per salesman | 150 | 202 | 200 | 201 | 199 | 198 | 198 | 199 |
| Used vehicle stockturn (days) | 45 | 56 | 55 | 55 | 54.7 | 54.73 | 53.7 | 54.6 |
| Return on used car investment % | 100 | 81.2 | 82 | 82 | 81.7 | 82 | 82.6 | 80.6 |
| Overall labour efficiency % | 100 | 81.4 | 81.5 | 81.7 | 81.8 | 82 | 82 | 82.1 |
| Service gross profit % on labour | 75 | 75.9 | 75.8 | 75.8 | 75.8 | 75.8 | 75.8 | 75.8 |
| Service expenses as % gross | 40 | 56.7 | 56.9 | 57.2 | 57.2 | 57.3 | 57.6 | 57.5 |
| Hours per retail job card | 2.5 | 1.65 | 1.65 | 1.65 | 1.65 | 1.65 | 1.65 | 1.65 |
| Parts gross profit % | 22 | 22.4 | 22.3 | 22.3 | 22.3 | 22.2 | 22.2 | 22.2 |
| Parts expenses as % gross | 40 | 44.4 | 44.6 | 44.8 | 44.7 | 44.7 | 44.7 | 44.5 |
| Parts stockturn | 8 | 7.7 | 7.7 | 7.75 | 7.79 | 7.84 | 7.85 | 7.62 |
Jeremy has been a journalist for 30 years, 20 of which have been in business-to-business automotive.
He was a writer and news editor on AM-sister brand Fleet News for three years before setting up the AM website.
For the last seven years he has been Bauer B2B’s head of digital helping to manage the digital assets of Fleet News, together with AM and RAIL.
In 2025 he was an Association of Online Publishers awards judge.


Login to comment
Comments
No comments have been made yet.