

Despite frequent talk of consolidation, disruptors and momentous events altering the shape of the industry forever, motor retail does not change quickly.
Not because nothing is actually changing, but because the underlying business model that governs dealer groups’ behaviour has not changed. Yet.
However, differences are emerging, and some of the challenges that may be most significant do not make the headlines.
Are car dealers facing a perfect storm?
Anecdotally at least, we are approaching a perfect storm. Consumers are rethinking their attitudes to mobility. Brexit and other uncertainties, dieselgate, and little or no increase in real incomes, has affected willingness to buy. We may be approaching ‘peak car’ and even if we are not, the car sales environment looks and feels as if we have.
Meanwhile, car production continues to outstrip demand and sales targets remain ambitious. At the same time, there is pressure to invest in showrooms, service facilities and the ubiquitous demands of corporate identity.
Simple economics would say that this means pressure on margins (more stock than is justified by demand), and an increase in volume and age of stock, with premises and fixed assets winning out over people and process.
As the graph below (fig1) shows, there has been a significant jump in the total stock held by AM100 groups. The amount of consignment stock has stayed roughly the same, but stock owned outright, or financed, therefore tying up debt and equity, has increased significantly.
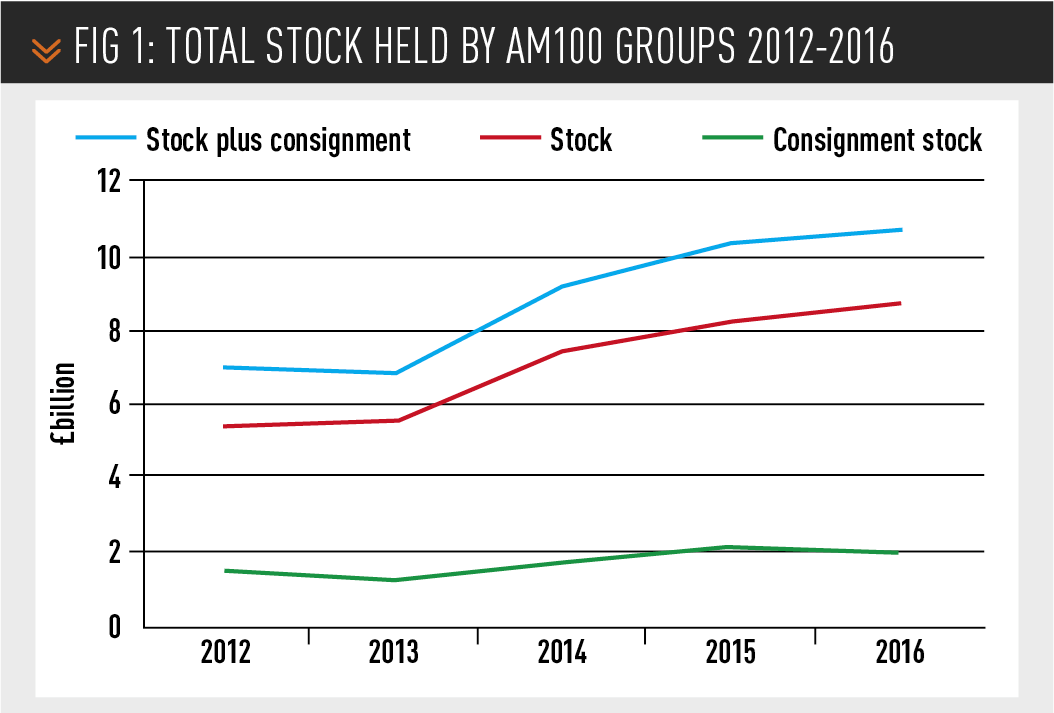
At the same time, over this five-year period, £2 billion more has been invested in fixed assets. Together, there has been a demand for an additional £6.3bn investment in stock and fixed assets.
This cash has to come from profits, or borrowings, or a combination of the two – equity and debt.
More has come from profits than from debt. The increase in equity (see fig 2, below) is greater than the increase in debt, but the demand on capital has increased by more than £2bn over the past five years.
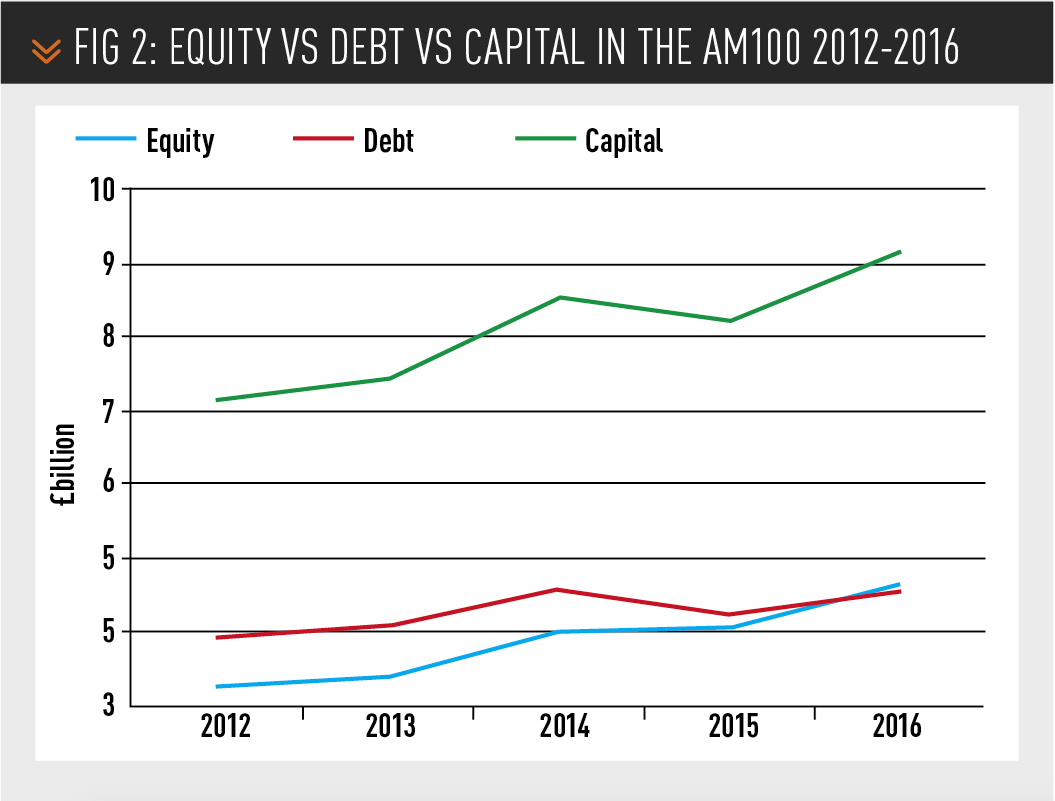
This £2bn increase in the capital requirement of the industry does not match the increase in stock and assets. It is difficult to analyse this difference precisely, because there are many different ways in which groups record the way they acquire stock. One answer could be that short-term credit (trade creditors) accounts for a large part of the difference, which indicates a higher risk profile for all concerned.
Motor retail continues to be resilient
It is a good thing that car retailing is essentially a cash generative industry. To understand that statement, we need to look at EBITDA – earnings before interest, tax, depreciation and amortisation.
EBITDA is a good measure of resilience. The annual depreciation and amortisation charge does not represent a cash outflow. The assets to which they relate were acquired in previous years, so the related cash outflow is in the past. EBITDA is near to the cash profit of the business and therefore represents its true capacity to continue operating.
In 2016, EBITDA for the AM100 amounted to £1.5bn. Profit before tax was roughly half that. So if all of the AM100 businesses broke even, they would still generate nearly £800 million in cash.
Without something to measure that against, it could be considered pretty meaningless. So back to those statistics on equity and debt.
Determining how much debt it would be reasonable to take on depends on your ability to pay it back. Therefore, another useful measure is the ratio of EBITDA to debt.
This ratio for the whole AM100 five years ago was 3.4. This means the AM100 could repay all its debt in 3.4 years.
Even better, the ratio has improved to 3.0 in the 2016 accounts. The AM100’s entire debt could be repaid in a paltry three years. Far from the industry showing a deteriorating risk profile, car retailing looks quite secure (bankers and investors, please take note).
However, this improvement has come largely by reducing debt and using equity reserves to take the strain. Fresh equity is difficult to come by and so using equity means reinvesting profits. This is no bad thing, but there is a limit, which is why debt plays an essential part in enabling growth and regeneration. With interest rates beginning to edge up and economic uncertainties a factor, it may not be prudent to look to debt. So both a rock and a hard place begin to emerge.
What has slightly changed?
There have been significant “local” variations in the AM100 over the past year, each of which are worthy of note. However, even if all of those events are aggregated together, they do not actually change the industry to any great degree. This particularly applies to acquisitions, disposals and failures.
For the past five years, the total profit before tax for the 20 most profitable car retailers has increased (fig 3, below). It has grown quite consistently, apart from a minor slowdown in 2015. Despite quite different challenges in the economic environment during those five years, the trend seems undisturbed.
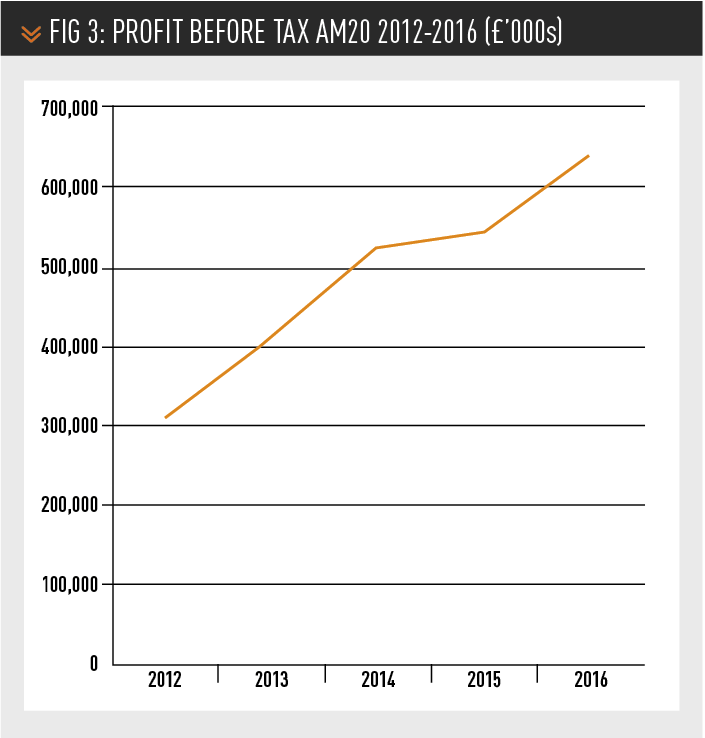
Despite the acquisitions (13 in 2016), turnover growth for the top 20 dealer groups has also grown steadily and smoothly. If the commentators on consolidation were to be believed, it should have grown by a significant amount, in leaps and bounds. Not so. Another more-or-less straight line.
There were only four major acquisitions in 2017, so expect the smooth trend line to continue.
However, it is interesting that all those acquisitions involve players from outside the UK – Group 1 from America and SuperGroup and Motus from South Africa. With sterling unlikely to strengthen, we may see more acquisitions of this nature, although the larger domestic groups sound as if they are gearing up for another round too.
Profitability in the AM100
The return on sales (RoS%) table for 2016 is pretty similar to those that have been presented in earlier years. Entry to the top 20 by RoS has improved very marginally, from 1.8% five years ago, to 1.9%. The top three or four all have a RoS of between 3% and 4%, the best over the past five years being 4.4% achieved by CEM Day last year.
The same can be said of return on capital employed (RoCE), although this time, the entry point has fallen from nearly 16% to just over 13.5%. This change does give a hint of where to look for the more
significant movement, of which more later.
We tend to focus on the best, the top 20, the upper quartile. But perhaps change is happening further down the table. A number of commentators have been forecasting tough times for smaller dealers and even their demise, as the ability to cope with today’s demands becomes more and
more the preserve of those with scale and access to larger quantities of capital.
This also is not supported by the facts. The average RoS% has increased over the five years from just over 1% to just below 1.4%. The best 20 dealers have produced roughly the same return and so the improvement must have come from the rest. Indeed, the distribution of results shows an improvement for the smaller dealers and those outside the best 20. The gap between “best” and “worst” has closed.
Piers Trenear-Thomas
The autumn update is based on statutory accounts for the immediately preceding year, therefore business sold after the end of the year will still figure in the tables. Any analysis of statutory accounts for a given year would be unrepresentative if businesses sold after that year ended were excluded.


 production line")


Login to comment
Comments
No comments have been made yet.