
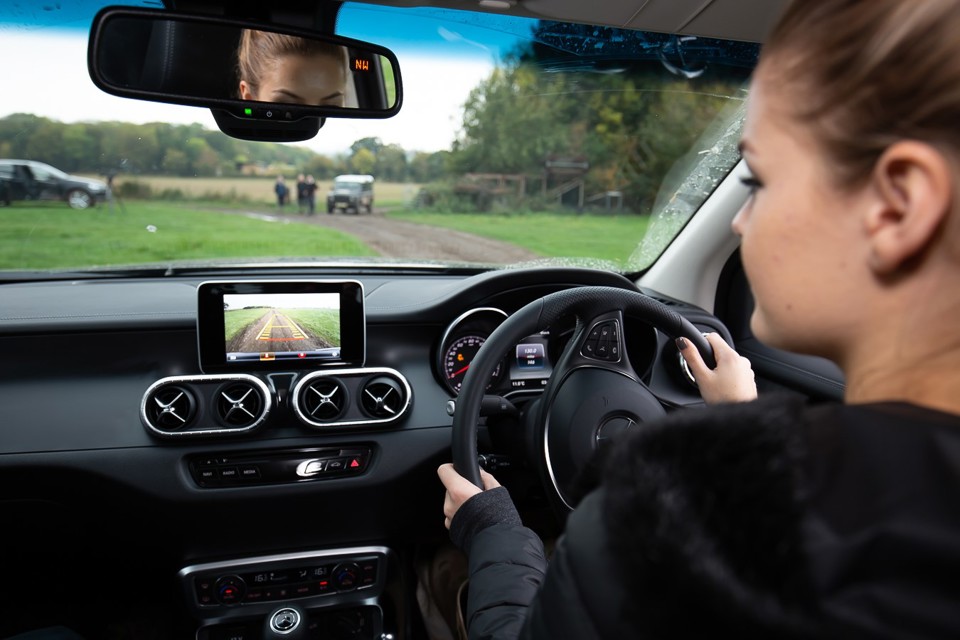
The Department for Transport’s (DfT) National Travel Survey (NTS) England 2018 shows that the proportion of men and women aged 17 to 20 with a driving licence has increased by eight percentage points in the last year.
The stats stand counter to the generally held concern that fewer young people are interested in learning to drive.
A statement from the report said: “This is an unusually large year-on-year increase, but more years are required to see whether this is a developing trend of more younger people learning to drive and passing their test following decreases from the mid-1990s.”
The report said the stats from the NTS stood out in particular as driving licence data for Great Britain for June 2017 and July 2018 based on DVLA records suggests a small increase in licence holding rates for young people aged 17-20, but not of the level seen in the NTS between 2017 and 2018.
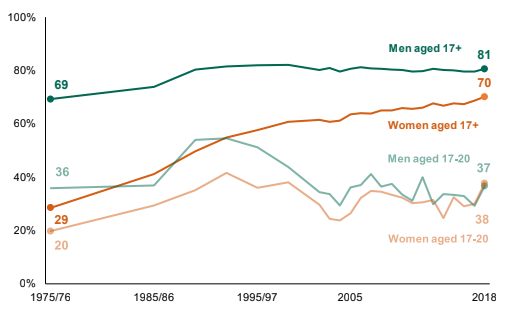
Over the last 40 years, the proportion of people having a driving licence has increased, with the increase being greater for women than men.
Over the time period since 1975/76, there have been significant increases in the proportion of people with a driving licence. For women, there was an increase from 29% to 70% over this period.
There have also been significant increases in the proportion of older people with driving licences.
Between 1975/76 and 2018, the proportion of people aged 70 and over rose from 15% to 67%.
The NTS is a household survey of personal travel by residents of England travelling within Great Britain, from data collected through interviews and a seven-day travel diary.
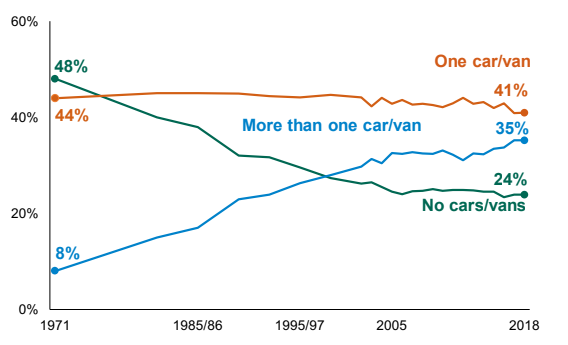
The overall data shows that 76% of households in England have access to at least one vehicle, 35% have two or more and 24% don’t have access to a vehicle.
The proportion of households without a car has fallen from 48% in 1971 (based on the Census) to 24% in 2018, while the proportion of households with more than one car increased over this period, from 8% to 35%.
In 1985/86, there were eight cars for every 10 households in Great Britiain; in 2018 there were 12 cars for every 10 households in England.
The NTS stats also show there are 33.6 million driving licence holders across those surveyed.
Vehicles took the lion’s share for the most popular mode of transport for the UK, accounting for 61% of all trips, representing 77% of all distance covered.
The cost of purchasing a motor vehicle is lower than 20 years ago, contributing to increased car ownership.
The Consumer Prices Index (CPI) shows that in 2018, the cost of purchasing a motor vehicle was 9% less than in 1998.
The ONS Living Costs and Food Survey showed that households spent around £27 a week on average purchasing cars and vans (both new and used, either outright or by loan/hire purchase). This works out at around 5% of total household expenditure on average.
The NTS results show that petrol vehicles accounted for 63% of vehicles owned, compared with 35.5% diesel and 1.5% “other”, which includes plug-in hybrid and electric.
Percentage of people owning a full driving licence: England 1975/76-2018
Percentage of households with access to a car: Great Britain (1971-1988 and England (1989-2018)
Author:
Tom Seymour
Freelance writer
Freelance writer for AM, Tom Seymour has been a specialist B2B journalist covering the automotive sector for over 14 years. He started his freelance career in 2015 and currently writes for a variety of automotive, business and technology publications.


Login to comment
Comments
No comments have been made yet.