Following a swift transition by car retailers from the COVID-19 lockdown to “the new normal” new car registrations got back on track for UK businesses in June.
But while Cazana director of insights, Rupert Pontin, questioned whether last month’s 34.9% year-on-year decline in new car registrations was down to car buyers desire to buy used, he was happy to report a steady market and value growth.
Read on for more market analysis in his Monthly Pricing Insight report:
June saw the end of one of the most difficult periods in automotive history in the UK following the worldwide economic challenges resulting from the COVID-19 pandemic.
The positive news is that from a used car pricing perspective, retailers did not, bar the odd exception, drop their retail pricing to try and drive sales.
The reality is there has not been a need to do so and the difficulty in replacing sold units has meant that price reductions may have brought a short-term boost to cash flow but resulted in a lack of cars to sell and was therefore, a short sighted and counter-productive strategy.
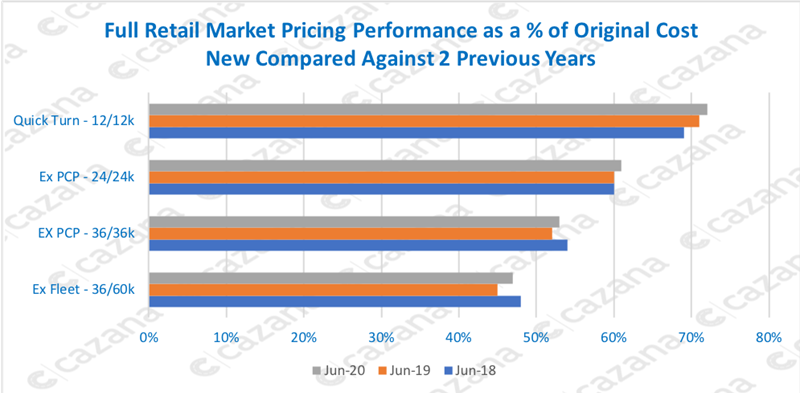
Looking in more detail at retail pricing and the chart below compares retail pricing as a percentage of cost new by age and mileage profile against two previous years.
 This chart gives a high-level indication as to the used car pricing position during June and it is immediately clear that pricing has increased across all age and mileage profiles although the pricing position is not as strong for three-year-old cars as it was in 2018.
It is also interesting to note the strength of the Quick Turn age and mileage profile for June 2020 which is stronger than it has been for some time.
This reflects the lower volumes of pre-reg cars in the market although it is worth noting that a higher % of original cost new can also indicate that the balance of premium brand product to volume OEM sourced cars may have shifted.
This may also be the reason that the new car registration figure for June was so low.
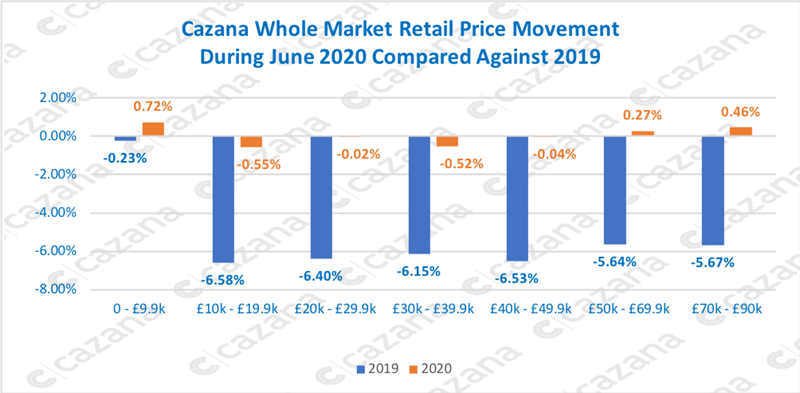
Looking in a little more detail and the chart below highlights pricing movements across the month by Price Range.
 This chart looks at the retail pricing movements across the whole market during June and not just individual advertising platform data, and as such is a more comprehensive view of the UK market retail pricing activity.
Focussing at a high level reviewing all fuel types, the data shows that for three price ranges there has been an increase in retail pricing albeit reasonably modest.
However, it is also important to note some minimal downward moves between £10k and £50k.
The overall monthly retail price summary is an increase of 0.03% and whilst small this reflects the strength of consumer demand during the month.
Looking at the detail in the data shows where the big gains and losses have taken place and this is essential to ensure maximisation of market nuances daily.
As a comparison, this chart also looks at the pricing movements during June 2019 and this qualifies the strength in the market in 2020 despite the impact of COVID-19.
Last year saw a whole market reduction in retail pricing across all fuel types of 6.38%.
Part of the reason for the strength in pricing has been the lack of available replacement stock.
As predicted by Cazana in early May the vehicle supply chain has proven to be in a somewhat weakened state and from June 1 as retail sale volumes climbed, the physical auction environment remained dormant until the middle of the month.
With only online auctions taking place it was difficult to source used car stock.
What exacerbated the situation was the fact that many of the logistics staff were, and in some cases still are, on furlough meaning the collection and delivery of cars was very slow to pick up.
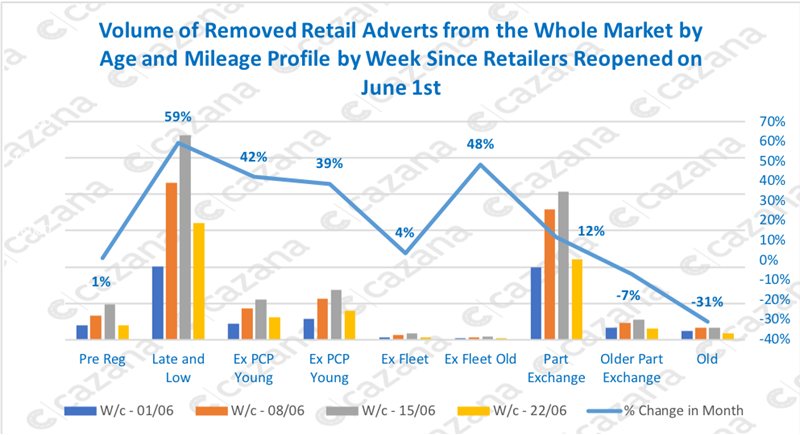
The next chart looks at how the volume of retail advertised cars changed during the course of June.

This chart reflects the volume of new retail adverts coming to the market week by week during the month and is shown by the bars and is also split by age profile.
The line quantifies the total percentage increase or decreases by age profile over the course of the month.
This data indicates the availability of replacement used car stock and can also be used to interpret the retail sales demand for cars by profile.
Therefore, in comparison to the beginning of the month the number of retail adverts for some age profiles increased significantly and this confirms that there was an uplift in the number of cars coming to the market.
This is interesting given the widely reported supply chain restrictions although could reflect the immediate boost in wholesale activity once the retail showrooms opened for business which subsequently depleted the supply of wholesale stock.
Of note is the drop-in adverts for the Older Part Exchange and Older car profiles and this corroborates the reports of increased demand for this age of car and highlights the shortage of replacement stock in the wholesale market. This ties in with the increase in price shown in the second chart for the sub-£10k price range.
In conclusion, looking at the whole month data, retail pricing has increased but only marginally.
It is wise to remember that the detail shows some significant peaks and troughs on a week by week basis specifically when looking at different fuel types, OEMs and individual models.
The retail consumer has largely felt comfortable with the new sales environment but at the same time, the development of “mouse to house” solutions has accelerated as predicted by Cazana in April.
This is essential to ensure the industry reaches all customers including those that feel uncomfortable going to the showrooms.
The short to mid-term future looks set to remain positive although consideration must be given to what may happen as the autumn approaches and some of the government financial support for consumers and businesses is withdrawn.


Login to comment
Comments
No comments have been made yet.