

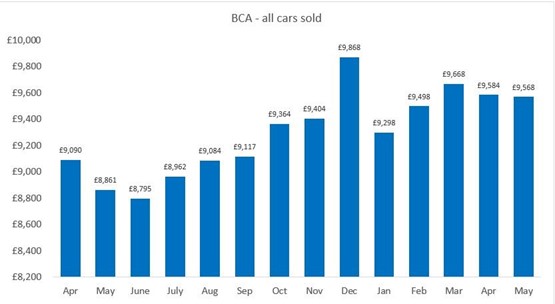
BCA has reported that demand from buyers continued to keep prices firm during May, with average values at near record levels.
The headline average value fell by just £16 to £9,568 in May, with average values up by £707 year-on-year, a 7.9% rise over the 12-month period. May’s average value is the fourth highest on record.
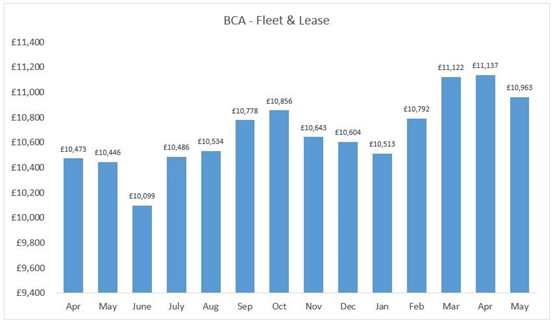
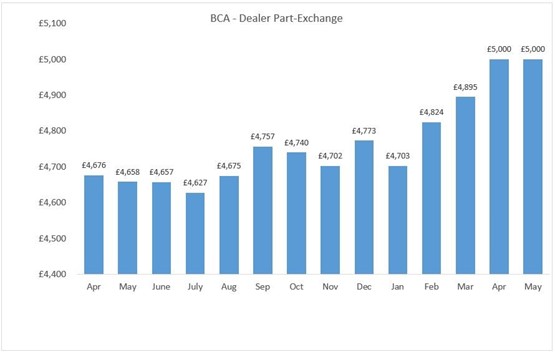
Fleet and lease values reduced marginally from last month’s record level to £10,963, still the third highest point on record, while dealer part-exchange values remained at a record high of £5,000 for the second month running.
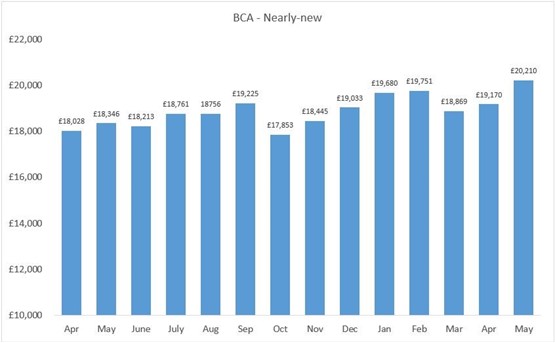
Values increased for nearly-new vehicles, although model mix has a significant influence in this low volume sector.
BCA’s chief operating officer UK remarketing Stuart Pearson said: “Professional buyers have continued to compete strongly for good quality used car stock, a pattern that reflects the high levels of retail demand that dealers have been reporting throughout this year.
"The seasonal dip that is often felt at this time of year hasn’t been so significant and the strong demand has driven conversion rates, meaning stock is churning quickly which is good for buyers and sellers alike.”
Year-on-year table: All cars
|
All cars |
Avg Age |
Avg Mileage |
Avg Value |
|
May 2017 |
55.02 |
48,751 |
£8,861 |
|
May 2018 |
54.63 |
47,576 |
£9,568 |
Average fleet and lease values slipped by just £174 (1.5%) to £10,963 from last month’s record value of £11,137. Despite this, values for fleet and lease cars in May were the third highest on record.
Retained value against original MRP (Manufacturers Retail Price) fell by half a percentage point to 43.54%. Year-on-year values were up by £517 (4.9%), with age rising and mileage declining, although both by small margins.
Year-on-year table: Fleet and lease
|
Fleet/ Lease |
Avg Age (months) |
Avg Mileage |
Avg Value |
Sales vs MRP |
|
May 2017 |
38.29 |
40,203 |
£10,446 |
42.63% |
|
May 2018 |
38.94 |
39,486 |
£10,963 |
43.54% |
Average dealer part-exchange values remained at a record level, staying at £5,000 for the second month running. Year-on-year values were ahead by £342, representing a substantial 7.3% increase over the 12-month period with age and mileage falling slightly.
Year-on-year table: Dealer part-exchange
|
Part-Exchange |
Avg Age (months) |
Avg Mileage |
Avg Value |
|
May 2017 |
88.66 |
69,315 |
£4,658 |
|
May 2018 |
87.84 |
68,543 |
£5,000 |
Values for nearly-new vehicles improved for the second month running, rising by £1,040 (5.4%) compared to April to reach £20,210. Values are up by £1,864 (10.1%) year-on-year. Model mix has a significant effect in this very low volume sector, with brand specific winners and losers.
Year-on-year table: Nearly-new
|
Nearly new |
Avg Age (months) |
Avg Mileage |
Avg Value |
|
May 2017 |
8.58 |
8,082 |
£18,346 |
|
May 2018 |
8.46 |
8,199 |
£20,210 |


 production line")


Login to comment
Comments
No comments have been made yet.